An eye for an eye – sports injuries and brawls

eye-sports-injuries
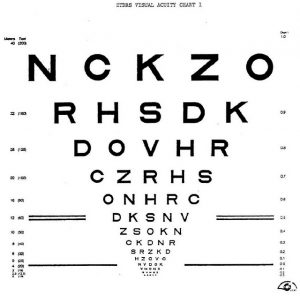
Eye chart image courtesy of Community Eye Health, CC https://flic.kr/p/cenNDu

The news photo of rugby league player Dylan Walker’s fractured eye socket made me feel anxious, like I get when I have an eye infection or it’s time for the annual glaucoma test. If I cover my left eye with my hand, I can navigate my way around the house, but that’s about it. No reading, watching TV or movies; definitely no writing, although I know vision-impaired people who have found ways around reading and writing.

What the auld aunties called a ‘gleyed ee’ or lazy eye was diagnosed in the late 1940s. I don’t remember wearing an eye patch when I was two, but I’ve seen the photos. It didn’t work. I say this only as an explanation if you passed me in the street and I did not say hello, it is possible you passed by on my right side.

Yes, so a serious injury to my left eye would probably see me lining up for the blind pension, although as I understand it, the aged pension replaces the (non-means tested) blind pension when the recipient reaches retirement age. An essay for another day, perhaps.

Last week the Australian Institute of Health and Welfare and Flinders University produced a report on eye injuries in Australia. The report shows 51,778 people were hospitalised due to eye injuries in the five-year period, 1 July 2010 to 30 June 2015. Two thirds of these were males. Falls (35%) and assaults (23%) were the most common causes of eye injuries. The most common type of eye injury was an open wound of the eyelid and periocular area (27%).

However, the report also showed that 86,602 people presented to an emergency department with an eye injury in the two-year period, 1 July 2013 to 30 June 2015. Only 1% of these cases (866) were admitted to hospital.

Sports-related eye injuries were seemingly uncommon by comparison, with just 3,291 males and 595 females reporting that the injury was sustained while participating in a sporting activity. However, information on what activity resulted in the injury was not reported for 69% of cases, so this is likely to be an under-estimation.

Of the known causes, more than one-third (37%) of males were participating in a form of football when they sustained an eye injury. Trail or general horseback riding (12%) was the most common sport-related activity resulting in eye injury reported by females. Over half (55%) of the sports-related cases resulted in an orbital bone fracture.

Such was the case during the Melbourne Storm-Manly rugby league game when a melee turned into a serious scrap between Manly’s Dylan Walker and the Storm’s Curtis Scott, with Scott throwing several punches, one of which broke Walker’s eye socket. Scott was sent off – red-carded as they say in soccer. Walker was given 10 minutes in the sin bin (for throwing a punch) and then had to be assessed for a head injury. Manly player Apisai Koroisau was also sent off for 10 minutes for running in and throwing a punch at Scott.

The National Rugby League (NRL) has been cracking down on such behaviour – Scott was the first person to be sent off for punching since 2015. All rugby league players know if they throw a punch they will at least be sent to the sin bin; angry flare-ups in recent years have tended to be of the push and shove variety.

But whether you follow rugby league or not, it was a bad look, for the sport and for all sports. Imagine the conversations over breakfast.

“Right, that’s it,” says Mum, whose son Billy (8) has been pestering her to play footie. “If you want to play sport you have two choices – soccer or table tennis. Those league blokes are thugs.”

Discussing the Manly/Storm fracas on the Sunday Footie Show, former Jillaroo Allana Ferguson commented: “If they did that in King’s Cross on Saturday at midnight and someone was injured they’d be off to jail.”

She makes a valid point.

A study last year by Dr Alan Pierce from La Trobe University found that repeated concussions in rugby league players have a long-term effect. He compared 25 former league players in their 50s with a control group of a similar age. The men carried out cognitive tests to measure memory and attention spans and dexterity tests to assess motor skills.

“What I’ve found is that the responses of retired rugby league players were significantly different to the healthy controls with no history of head injury,” Dr Pierce told the ABC.

The NRL took steps in 2015 to introduce mandatory head injury assessments (HIA), where players who have suffered a head knock have to leave the field for 15 minutes and be assessed by a doctor. If found to be concussed, they are not allowed to return to the field that match. An NRL injury surveillance report by Dr Donna O’Connor found that head injury assessments increased from 210 in 2015 to 276 in 2016, largely due to strengthened concussion guidelines. Sixty-six per cent of these cases were cleared to continue playing in 2016, compared to 54% in 2015.

If you have seen the excellent Will Smith movie Concussion (about brain injuries in American football), you may well ask why it took the NRL so long to act.

Cheek and eye socket fractures are common injuries in rugby league. They come about through (accidental) contact in tackles, as big bodies collide. Sometimes it happens through ‘friendly fire’ collisions with teammates.

Such was the case with Broncos forward Josh McGuire, whose injury in 2011 required surgery and he is now effectively blind in one eye.

Sports Medicine Australia says the incidence of sports-related eye injuries is low, but severity is usually quite high, as injuries to the eye can result in permanent eye damage and loss of eyesight.

“Research has shown that 30% of sports-related eye injuries in children have the potential for permanent loss of eyesight.

“A blow to the eye from sporting equipment, fingers or balls can lead to injuries ranging from lid haemorrhages or lacerations, corneal abrasions, retinal detachments and hyphaema (bleeding inside the eye) to permanent loss.”

Rugby league is rated a ‘moderate’ risk sport (in relation to sustaining eye injuries) compared to high-risk categories including baseball/softball, basketball, cricket and racquet sports. Any sport that involves small projectiles moving at speed is considered high-risk.

Our family GP once told me most serious eye injuries he had encountered were caused by squash balls and champagne corks.

If you lose an eye, the alternatives are an ocular prosthesis (a glass eye) or an eye patch, the latter having a bad press courtesy of movie bad guys. Think John Wayne’s bullying Rooster Cockburn in True Grit, Adolfo Celi’s menacing Emilio Largo in Thunderball, or John Goodman’s itinerant bible salesman Big Dan Teague (O Brother Where Art Thou).

If it came down to it, I’d opt for a good quality prosthesis, although the price (from $2,500), makes a $10 eye patch look like a bargain.

I’d make it a different colour just because I love that line in the Paul Kelly song about falling for a girl with different coloured eyes.

In the meantime, I will keep wearing Australian Standard safety glasses when I mow the lawns or use the brush cutter. You should too.

 

Whipping up a dust storm in D

dust-storm
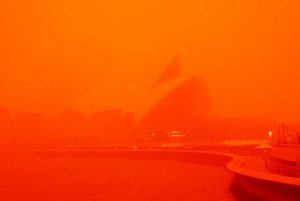
Dust storm obscures Sydney Opera House, September 2009. Image by Janet Kavanagh, NSW Maritime, CC

While innocently vacuuming never-ending dust this week, I accidently sucked up the D harmonica which was lying on the coffee table. Said harmonica emitted a plaintive sound, closely resembling the wheezy noise of a piper warming up (think, You’re the Voice, Eric Burden’s Sky Pilot and that AC/DC song about it being a long way to the shop if you want a sausage roll).

Alarmed (these little blues harps cost $45 a piece), I managed to grab one end before it disappeared into the dusty bowels of the 10-year-old Wertheim. After a short struggle and a discordant approximation of the intro to Blowin’ in the Wind, I freed the harmonica and continued on my merry way.

Most household tasks have fallen my way since She Who is Ambidextrous (SWIA) broke a bone in her wrist, although to be serious, using the vacuum cleaner has always been one of my chores. This machine has seen better days, but it still does the job. The broken hose is securely held together with gaffer tape and a pair of chopsticks. A while ago I priced a replacement hose at a vacuum cleaner shop (I could have bought a budget-level machine for the same money). The enterprising young lad managed to side-track me to a really up-market vacuum cleaner which, I discovered after a 20-minute spiel, cost $1,799.

“I could buy a 20-year-old Toyota Corolla for that sort of money,” I said, “Nice try, kid.

I went out of the shop happily humming ‘I love my Toyota Corolla, aha hah,’* having spent no money at all. Instead I went to one of those big red and green barns and bought a roll of gaffer tape.

Maybe 36 years ago (or more), I succumbed to a sales pitch when a colleague sent his uncle around to sell me a vacuum cleaner. I had been telling this colleague how the old machine was seriously incapable of sucking up not only dust but hair and dander from a Golden Retriever.

So Uncle Harry called around, to demonstrate the superior dust sucking power of a top of the line Electrolux, in the days when top quality appliances were manufactured here and sold door-to-door with a five or even 10-year warranty.

I bought the Electrolux on time payment, because that was the only way to finance such an extravagant purchase in those impecunious times.

I’ve earned a few million (sic. Ed.) dollars since then and that old machine refuses to die. It’s now the ‘downstairs’ vacuum cleaner, although I’ve been known to use it upstairs when (as is a common problem), temporarily unable to source the right-size dust bags.

“That old thing still does the job,” said She Who Told Me in Week 3, “I Don’t Vacuum”. (My Dr. said I shouldn’t vacuum- bad for the back. Ed.)

A while back, when the tiler had finished laying tiles in our downstairs rooms I (without thinking), took the Electrolux out and started sucking up tile dust. It was the smell that alerted me – smoke pouring out the top of the machine. The bag was chockers. I let the Electrolux cool down, put in a new bag and what do you know, it continued on untrammelled, a glass half full version of the Millennial expression, “This sucks”.

I’m completely sure no manufacturer today could produce a vacuum cleaner (or any appliance), that would last 36 years and more.

This line of thinking led me to research robotic vacuum cleaners, which can be bought for as little as $129 or as much as a 20-year-old Toyota Corolla. Choice magazine generally gave all models the thumbs down when marking them on the capacity to extract dust from carpet.

The intelligent vacuum cleaner does a pretty good job on hard floors, although why you’d prefer a round model over a square one (to get into those nasty little corners that harbour ancient dust), is a mystery.

The perplexing thing is this: where does dust come from and why does it settle again after one pass with a vacuum cleaner? As Quentin Crisp said in The Naked Civil Servant: “There is no need to do any housework at all.After the first four years the dirt doesn’t get any worse.”

Dust mites and chronic allergies

I will acknowledge to being a little bit fussy about vacuuming, ever since the allergist did the pin prick tests to show I was hyper-allergic to dust mites. On first discovering this in the 1990s, we hired a heavy duty industrial vacuum cleaner and paid an agile friend to clean the crawl space in the attic of our 60-year-old house. After the fourth big black garbage bag was passed down the ladder to the respirator-wearing assistant, our friend declared that was one job he was never doing again.

It’s not too hard to find out the answer to the question, where does dust come from? Science Daily surmises, not so surprisingly, that most house dust comes from outside. The scientists developed a computer model that could track distribution of contaminated soil and airborne particulates into residences. They found that over 60% of house dust originates outdoors. The study by the American Chemical Society found that contaminants like lead and arsenic can find their way into homes via airborne dust.

Researchers David Layton and Paloma Beamer found that household dust included dead skin shed by people, fibres from carpets and upholstered furniture and tracked-in soil and airborne particles blown in from outdoors.

The 2009 report mentioned above came out in the same year a 500 km wide dust storm the colour of Donald Trump’s complexion swept across New South Wales and Queensland. The Australian capital, Canberra, experienced the dust storm on September 22 and a day later it reached Sydney and Brisbane. Thousands of tons of dirt and soil lifted in the dust storm were dumped in Sydney Harbour and the Tasman Sea. Ah yes, you remember that.

Random dust storms aside, the real culprit feared by those suffering from asthma and hay fever is the dust mite. Scientists agree that dust mites thrive among the aforementioned dead skin discarded by humans and pets. The dustier your mattress and pillows are, the worse the problem gets. As this fascinating but skin-crawling article says, there could be between 100,000 and one million dead dust mites (and mite dung) lurking in your bed. Ugh!

What you need to do, every time you change the sheets, is to strip the bed, hang the bedding out in the sun then attach the nifty little mattress cleaner that may or may not have come with your vacuum and give the mattress a good flogging, so to speak.

Or you could buy a robot vacuum cleaner and instruct it to spend all afternoon roaming around on the bed:

As Hal said in 2001 A Space Odyssey: “I’m sorry (Bob), I’m afraid I can’t do that.”

*(a reference to Tiffany Eckhardt’s love song to her Toyota Corolla)  

FOMM back pages/related reading:


WWI Pacifists, Conchies and Rejects

WWI-Rejects-Conchies
WWI Rejects, Montville Memorial Gates, photo by Bob Wilson

Amidst the salvo of Anzac Day stories, the people least often talked about are those who did not take part in WWI,  either because of a Christian or moral objection, for practical reasons, or because the armed forces rejected them. According to the Australian War Memorial, 33% of men volunteering for the Australian Imperial Forces (AIF) in 1914 were rejected on medical/fitness grounds. Enlistment standards were gradually relaxed in ensuing years, allowing many of the rejected men to enlist. Key among these changes was to reduce the minimum height of a recruit from five foot six to five feet.

The World War I rejects don’t get much press at all: the blokes with poor eyesight, bad teeth, flat feet, hernias or some  other physical ailment or disability which ruled them out for active service. But once rejected, they often had to bear the same stigma as the despised ‘Conchies’ or ‘CO’s’ – our unique slang for conscientious objectors. In Australia, CO numbers were estimated at less than one in 30.

Globally, there were around 16,000 conscientious objectors during World War I and their numbers swelled to 60,000 or more in World War II. During the Vietnam War, hundreds of thousands sought deferment of the call-up or, in the case of American objectors, fled across the border to Canada.

Despite the early fervour to enlist for World War I, the country on the whole rejected the notion of conscription. PM Billy Hughes took the issue to a plebiscite twice during WWI and each time narrowly lost.

Meanwhile in tiny New Zealand (1914 population 1.1 million), the government simply passed a law and conscripted young men for the war effort. And as at least one controversial account claims, they took a very dim view of men who refused to fight on religious or ethical grounds.

Archibald Baxter, father of New Zealand’s late poet laureate James K Baxter, was one such staunch CO – an absolutist to the last.

His autobiography ‘We Will Not Cease’ makes for startling reading as it sets out the cruelty inflicted by his own countrymen on those who refused to fight. Baxter’s son wrote a poem with the searing lines:

When I was only semen in a gland

Or less than that, my father hung

From a torture post at Mud Farm

Because he would not kill.” (Pig Island Letters, Oxford U.P.1966).

Baxter Jnr’s poem, which describes his father’s ‘blackened thumbs’ refers to Field Punishment No 1, also the name of a 2014 New Zealand television movie. CO’s were hung up on poles (on the front line), in faux crucifixion pose, in the hope they would somehow recant.

Baxter never did.

The mistreatment of conscientious objectors in New Zealand has come to public attention in recent years, first through a public exhibit, and later by an opera, ‘War Hero,’ based on Archibald Baxter’s book.

Meanwhile back in Australia, for those who desperately wanted to enlist, particularly for World War 1, being found unfit to serve was a cruel blow that caused many men to become social outcasts. Unless employed in some clearly supportable on-land war effort, when these seemingly able-bodied men of a certain age were seen out and about, they were often subject to much derision.

The nearby hinterland hamlet of Montville holds a unique place in World War I history, as explained in a Canberra Times feature by Chris Sheedy, commissioned by the Canberra campus of UNSW.

The Montville War Memorial lists the local men who served with the AIF, but also the ‘Rejects’, the men who wanted to serve, but were classified as unfit.

Sheedy writes that in the celebrations of the homecomings of soldiers during and after WWI, most communities around Australia ignored those who didn’t serve.

“In fact, many shunned the ‘shirkers’ and were divided into segments of those whose family members had served and those who had not.”

The authorities must have foreseen this by developing badges for those who volunteered but were deemed ineligible to enlist, or honourably discharged because of age, injury or illness.

Sheedy notes that many men chose not to volunteer for practical reasons – they had a family to support or a farm or business to run.

Professor Jeffrey Grey from UNSW Canberra cites Robert Menzies as a prominent person who chose not to volunteer. Menzies had two brothers who went to war but the siblings agreed that Robert (a lawyer), would stay because he was more likely to provide for his parents in their old age.

Australian folk singer John Thompson, who has researched and written songs about WWI, describes it as a time when there was indeed a mood in the country among young, single people to ‘do your bit’. Thompson developed a song about Maud Butler, a teenage girl who so wanted to do her bit she dressed up as a soldier and stowed away on a ship. She got caught, but later made several other attempts to enlist.

As Thompson explains in the introduction to the song, Maud scrounged up the various pieces of an army uniform. “But she couldn’t get the (tan) boots and that’s what eventually led to her being discovered.”

Maud climbed arm over arm up an anchor rope to stow away aboard an Australian troop carrier. Historian Victoria Haskins, who researched the story, recounts how Maud gave interviews a few days after her return to Melbourne on Christmas Day, 1915.

Maud told local media that she “had a terrible desire to help in some way, but I was only a girl… I decided to do something for myself.”

While there may have been an initial wave of patriotism and a naïve yen to support the British Empire, volunteer numbers dropped in the latter years of the war.

The Australian War Museum estimates that 420,000 Australians enlisted in WWI, approximately 38.7% of the male population aged between 18 and 44. So despite the enormous peer pressure on young men to enlist, 61.3% of enlistment-age men did not join the war effort, for whatever reason.

Enlistments peaked at 165,912 in 1915 and declined in the ensuing years to just 45,101 in 1917 and 28,883 in 1918, the year the war ended.

Most of the literature about Australia’s involvement in WWI emphasises the 420,000 who enlisted, rather than the 665,000 or so who did not.

Given that a majority of men aged 18 to 44 either did not volunteer or were rejected by the AIF, it seems absurd to perpetuate the myth of the shirker. Those who stayed behind because of family loyalties, businesses, careers, or simply because they felt it wasn’t their fight, did not deserve to be ignored or worse, handed a white feather in the street or have one left in their mailbox. It is shocking to recall that a formal Order of The White Feather was formed to encourage women to pressure family and friends into enlisting.

As the AWM comments: “Some criticised the practice, arguing that ‘idiotic young women were using white feathers to get rid of boyfriends of whom they were tired.’ ”

It wouldn’t work today.

FOMM back pages

Australasia and World War II – things you may not have known


world-war-ii-new-zealand
World War 11 and impact on New Zealand

I grew up in the backblocks of New Zealand, ignorant until quite recently about the impact of World War II at home, particularly friction between American and Kiwi servicemen.

Prior to the 90th birthday of a family member in New Zealand, I did a modicum of research to find out what it was like for a Kiwi lad growing up in the World War II years. Amongst other things, I discovered that when this fellow was 15 (April 1943), a brawl broke out between American and New Zealand servicemen in Wellington in what became known as “The Battle of Manners Street”. The brawl, which has been greatly exaggerated over the years, lasted about four hours and was eventually quelled by civil and military police. There were other antagonistic affrays between soldiers and sailors in Auckland and a second incident, in Wellington’s Cuba Street.

As happened in Brisbane and other Australian capital cities, women formed romantic liaisons with American troops. About 1,500 Kiwi women married Americans during World War II. As recounted in New Zealand History online: “The soldiers were starved of female company, and many Kiwi women were charmed by the Americans (sic) good manners and ability to afford taxi rides, ice-cream sodas and gifts of flowers.”

Between 1942 and 1944 up to 45,000 American soldiers and sailors were based in New Zealand, before or after the war in the Pacific.

Most readers would be familiar with the much-chronicled “Battle of Brisbane” – a vicious World War II brawl between US and Australian troops on November 26 and 27, 1942, an incident army censors sought to supress. The fracas was sparked by tension between US and Australian servicemen over the former’s extra-curricular activities with local women. American troops were better paid, better turned out and had access to luxuries like chocolates, nylons and cigarettes (Or as the saying apparently went ‘Over-sexed, over-paid and over here’ Ed). Smokes were available to US troops duty free from a canteen in Queen Street. Australian troops complained about the unfairness of this and, after briefly being given access to the canteen, the practice was deemed illegal.

In New Zealand as in Australia, allied troops engaging in public brawls was certainly not what the top brass wanted to read in newspapers. There is evidence that much of the detail about the three-hour Battle of Brisbane was hushed up at the time, likewise the Manners Street incident. Censorship was loosened in 2013 with the release of previously classified CIA documents. In one of these documents, a 1942 report by US war correspondent J Edward Angly (which I downloaded from the CIA website), observed that resentment was rife among Australian troops during World War II. The Americans were more affluent and by reasons of their manners and appearance, more attractive to local women. There was also some tension in that the Australian militia could not be sent to a Pacific theatre of war beyond their mandated territory. “The Americans know this and are inclined to rib the Australians about it,” Angly observed.

The “Battle of Brisbane,” where up to 4,000 people slugged it out on the streets, resulted in one fatality and eight serious injuries.

Anyone who has seen Queensland Ballet’s evocative production of ‘Cloudland’ would recall the tension between American and Australian servicemen, out for a night of drinking and dancing at Brisbane’s once famous dance hall.

On the 75th anniversary of the Battle of Brisbane, Dr Judith Powell said in a blog the incident had become such a part of Brisbane folklore that when Queenslander Jeff Horn met reigning welterweight champion Manny Pacquiao in the boxing ring at Lang Park, the event was billed as “The Battle of Brisbane”.

The Battle of Manners Street does not hold that kind of mystique, but looking into it allowed me to discover that World War II had more of an impact on Kiwis at home than we might realise.

On June 19, 1941, the liner RMS Niagara was sunk by a mine laid by the German auxiliary cruiser Orion off the coast of Whangarei, north of Auckland.  Everyone aboard escaped and was transported to shore.  But a large consignment of gold from the Bank of England worth £2.5 million pounds went down with the ship. The gold was a (then secret), payment from the UK to the US for munitions supplies.

German surface raiders operated in New Zealand waters in 1940 and 1941, sinking four ships. Japanese submarines also operated in New Zealand waters in 1942 and 1943. They sent reconnaissance aircraft over Auckland and Wellington, but did not carry out any attacks.

For all of that, Kiwis tend to remember the more emotive brawl between (inebriated) soldiers in Wellington’s streets and laneways. There were racial elements to both brawls, with the presence of African American sailors and soldiers in Australian cities a challenge to the then ‘White Australia’ policy. Various sources say the Battle of Manners Street was sparked by US servicemen and sailors complaining about Maori servicemen being served alcohol in the Allied Services Club. The Maori soldiers in turn complained the Yanks were getting preferential treatment.

Up to 1,000 people, including some civilians, were involved in skirmishes which were quelled by civil and military police three or four hours after the violence started. No reference to the riots appeared at the time in local newspapers or on the radio.

According to a 2013 update by stuff.co.nz, false rumours that two American serviceman had died that evening persisted for decades.

It is worth pointing out that servicemen on furlough typically went on drinking binges and in New Zealand at the time, pubs closed at 6pm.

The ‘Six O’Clock Swill’ was notorious for prompting binge drinking and bad behaviour in general.

Hard to imagine the Australian and US military having such antipathy today, drunk or sober, especially when it appears that we are still able and willing to support the American military when the occasion arises. Although Australia was not directly involved in missile strikes on Syrian targets, PM Malcolm Turnbull has not ruled out joining the US, UK and France in future military action if Syrian leader Bashar al-Assad again uses chemical weapons.

Never mind that, you say, what happened to the gold?

Oh, the gold? Yes, 94% of it was salvaged for HM Government by an old ship that found the wreck by dragging its anchor back and forth across the Whangarei harbour (exploding the occasional mine). According to this Wikipedia entry, there are still five gold bars down there – somewhere.

Even after 78 years, the legacies of war keep surfacing. Kiwi environmentalists are pressuring the government to assess the risk of a major oil leak from the Niagara.

Auckland Conservation Board chair Lyn Mayes told the New Zealand Herald last year that the rusting hulk was a ‘ticking time bomb’. While only sporadically leaking oil over the years, the Niagara’s two main oil tanks still contain 2000 litres of oil.

Which makes you wonder about the wrecks of 30 ships sunk by German and Japanese submarines around Australia’s coastline between 1942-1945.

I  don’t like the use of the word ‘famous’ in this list of shipwrecks as so many of them represent lives tragically lost at sea. But it is a fascinating peek into our war-time history.


Facebook – does it really matter if they share our data?

first-facebook-postSince we’re discussing Facebook and who has the rights to personal information you’ve posted, I wanted to show you my ‘Wall.’  People used to call their Facebook page their ‘Wall’, though that has become passe. As walls go, this one would be ‘liked’ by Shirley Valentine fans (cultural reference), as it suggests romance and sun-bleached beaches.

    I joined Facebook in 2009 (apparently) as this is the first image I posted. At the time we were renovating the downstairs bedroom, rumpus room laundry and ensuite. Apart from hiring a guy to lay tiles throughout, we did all the work ourselves. If I’d known better, I’d have first put a coat of sealer on the besser brick wall as it took four coats of paint until it matched the hardboard on the opposite wall.

    I resisted joining Facebook for such a long time and then when I did, my posts were few and sufficiently opaque to resist understanding by all but my inner circle.

    Facebook has proved handy in terms of keeping in touch with younger family members around the world because, as we know, they don’t write letters. So too I’ve formed loose ties with musicians around the world, which can either be a way of sharing the passion or fishing for a gig.

    Later, Facebook became a good way of spreading the news about folk music events in our small town, some of which we promote.

    Dani Fankhauser’s history of Facebook on mashable.com charts the development of Facebook from its launch in 2004 and the 18 features it used to have and either changed or discontinued. I had no idea the original idea of the ‘wall’ was that people could use it like a whiteboard, leaving messages for their friends. You could change or delete what was there and replace it with your own messages. As Dani says, at one stage it was cool to ‘de-virgin’ someone (be first to post on their wall).

    The wall disappeared and Timeline took its place. Other critical changes since Facebook was launched includes the controversial and constantly changing News Feed and the over-weaning Like button which turned social interaction into a competition.

    Dani writes that Facebook used to be like a journey down the Rabbithole, being diverted down unexpected paths to discover new and interesting worlds. Now it’s like standing in front of the fridge with the door open, not quite sure what you’re looking for. Five years ago she wrote that – has anything changed?

    The hoo-haa about fake news and private data being manipulated by computer data experts should surprise no-one. If you are on Facebook, you are the content.

    You have probably read one version or another of the Cambridge Analytica scandal. The Guardian Weekly ran a two-page expose this week so if you really want to delve into it, here’s the ultimate link.

    The fall-out when this news broke was most noticeable on Wall Street. When the Observer revealed that Cambridge Analytica had harvested millions of people’s user data for political profiling, Facebook’s stock plummeted. It fell 17% between March 17 and Easter, wiping $US50 billion off the company’s value. Regulators in several countries are investigating Facebook and may try to limit how the company makes money from data.

    Meanwhile,Google, Apple and Amazon are like little kids who played a joke on someone and are now hiding behind a tree, giggling. The laugh might be on them, according to this broader story.

    There is a social movement (#DeleteFacebook), but social media analyst Andy Swan, writing for Forbes magazine, said the spike in Facebook deletions – the highest since 2004 – peaked on March 21 and has been in decline ever since.

    Most of the outrage stems from reports that Donald Trump’s campaign consultants, Cambridge Analytica, used ‘psychographics’ which allows personality traits to be manipulated.

    But what about our music pages, Mark?

    In January this year Facebook began changing the algorithms that influence what users/members see in their news feed. Facebook founder Mark Zuckerberg said the changes were made because of feedback that public content – posts from businesses, brands and media – was ‘crowding out the personal moments that lead us to connect more with each other’.

    Changes started last year and as Zuckerberg said in a Facebook post, will take months to implement. “As we roll this out, you’ll see less public content (in your Newsfeed) like posts from businesses, brands, and media. And the public content you see more will be held to the same standard – it should encourage meaningful interactions between people.”

    This must be a deeply disturbing trend for mainstream media, which has hooked its disintegrating business model to the hems of social media’s skirts.

    Our local paper, the Sunshine Coast Daily (now owned by Rupert Murdoch’s News Ltd), recently ran a 150-word ‘news story’ – Keep News #1 in your Facebook feed. The article suggested Daily readers keep up with the latest local news by ‘making a simple adjustment’.

    This means first find the SCD page on Facebook, like, click ‘follow’ then click ‘see first’.

    Well yes, it works, but it didn’t take long for the stream of sensationalist stories to ‘clutter up’ my news feed and the same could be said of choosing this option for other media outlets. Beware the Paywall!

    Just for the mental exercise, I downloaded my Facebook data. It has always been possible to download your own data and if we were smart, we’d all do it every year so we at least can find copies of the photos we posted then forgot about. Just go to your profile page and click on settings (the link is at the bottom of the page).

    Just downloading your data file does not mean you are deleting your information from Facebook. Leaving, closing your account and demanding the return of the original data is not so easy.

    But it was illuminating to trawl through this 136MB file. There is an exchange (a thread) between me and a former colleague. I wished to write something about him in my blog, about the merits of academic ambition when one is supposedly past student age. Within the conversation, my former colleague revealed quite a lot of detail about his school years, what work he did on leaving school and how he came to study journalism. I used hardly any of this information in the blog which was eventually published. But it is sitting there quietly, within my (private) Facebook data files. Let’s hope it stays that way.

    So what does the Cambridge Analytica privacy furore mean for folk who just want to post photos of their cats, dogs, partners and kids? Not much, I suspect, unless you have a ‘brand’ page like the ones I use for pur stage name, The Goodwills and this blog.

    I thought it would be fair play to share Mark Zuckerberg’s Facebook post. It is interesting for his over-use of marketing-speak and the sometimes snarky comments which follow his ‘community-oriented’ explanation for making business, brands and media pages less visible.

    I’m with the people who asked why couldn’t Facebook users simply curate their own news feed without having it dictated by algorithms.

    Meanwhile, if you want to keep the Bobwords brand page at the top of your news feed, click on the link, like and follow.

    Or not!


    Housing affordability and the empty homes scandal

    housing-affordability-empty-houses
    Housing affordability in world capitals. Photo of Melbourne’s Southbank by Ashley Rambukwella flickr CC https://flic.kr/p/KfdUMR

    The inspiration to start writing (again) about housing affordability came from left field. I was sitting back enjoying an American roots band, The Brothers Comatose, at the Blue Mountains Music Festival in Katoomba. Lead singer and front man Ben Morrison introduced the band, saying they were from San Francisco but maybe not for long. “The price of houses is crazy there (man) and most of the musicians I know are moving out because they can’t afford to live in the area.”

    “Maybe we could move here,” he suggested, and the audience groaned, knowing that housing affordability is just as big a problem in Sydney and surrounds as in San Francisco, Vancouver, New York or Paris.

    “Can we sleep on your couch?’’ he jested, before doing what musicians do to avoid thinking about the cost of living. Great band, by the way (check out this bluegrass old-style tune around one microphone).

    Morrison’s complaint rang true – I did a modicum of housing affordability research which quickly showed that the median price of a house in San Francisco’s Bay area clipped $US1.5 million in the fourth quarter of 2017. The California Association of Realtors Housing Affordability Index shows that it would cost $US7, 580 a month to service the mortgage. The average monthly rent for a two-bedroom apartment is $US3, 441.

    Housing affordability is a myth in Vancouver, Canada’s biggest West coast city. The 14th annual Demographia affordability study ranked Vancouver the least affordable among 50 American and Canadian cities. Internationally, it is ranked the third least affordable city among 293 locations around the world (Sydney was 2nd). The British Columbia Provincial Government has made several attempts to rein in the city’s galloping real estate prices, including a 15% tax on foreign nationals purchasing metropolitan real estate. Another new measure attempts to tackle a problem that plagues Sydney and Melbourne, Australia’s housing affordability problem cities.

    The BC government conducted a survey which found that 8,481 houses in Vancouver were unoccupied during a six-month period. That’s 4.6% of the housing stock. Now the government is going to levy a tax on people who own houses and don’t occupy or rent them. The tax will be calculated at 1% of the assessed value. So the owner of a two-bedroom condo in Vancouver valued at $900,000 and deemed to be unoccupied will pay the BC government $9,000 a year.

    Meanwhile, the housing boom in Vancouver is on the downturn, according to the Vancouver Courier, and they should know. Still, with a median house price around $3 million (Dec 2017) and condos going at $1 million apiece, it’s maybe time for that bubble to lose some air.

    Meanwhile Down Under, house prices keep rising

    Melbourne and Sydney made into Demographia’s top 10 list of the least affordable cities in the world. Sydney’s median house price of $1.11 million assured it of that invidious claim. Demographia ranks middle income affordability using a price-to-income ratio. Anything over 3 is rated unaffordable. On this basis, some of the world’s most affordable towns included Youngston, Ohio (1.9), Moncton, New Brunswick (2.1) and Limerick, Ireland (2.2). There are no affordable Australian cities on Demographia’s watch.

    The least affordable city is Hong Kong (19.4) then a gap to Sydney (12.9) and Vancouver (12.6). Melbourne (9.9) is slightly more unaffordable than the aforementioned San Francisco (9.1).

    Studies have shown that Melbourne is one of the big culprits in hiding empty houses among its residential property stock.

    Australia’s 2016 Census showed that 11.2% of Australia’s housing stock was described as unoccupied on Census night. Empty property numbers were up 19% in Melbourne and 15% in Sydney compared with the 2011 Census. This growing anomaly is a global trend in the world’s biggest cities which have allowed rapid apartment developments.

    Just why 1.089 million houses and units were unoccupied on Census night is hard to explain. But it probably suggests the owner/s were not in need of rental income and would rather keep the place in mothballs for use when the wealthy owners or friends and relatives visit (for the Australian Open, Melbourne Cup or the Grand Prix) or are relying on capital gain without the need to bother with tenants.

    Hal Pawson of the University of NSW wrote in The Conversation that the spectre of unlit apartments in Melbourne’s night sky prompted the Victorian government to introduce an empty homes tax. Like Vancouver, this is levied at 1% of the property’s value. Similar taxes have been introduced in Paris and Ontario. Mr Pawson, Associate Director – City Futures – Urban Policy and Strategy, City Futures Research Centre, Housing Policy and Practice, UNSW, (try getting an acronym out of that. Ed.)  says the Melbourne tax only applies to inner city and middle suburbs and, there are ‘curious’ exemptions for foreign nationals with under-used second homes.

    The flaw in the scheme is that it relies on self-reporting. Pawson says the lack of reliable data on empty homes is a major problem in Australia.

    Census figures substantially overstate the true number of long-term vacant habitable properties because they include temporarily empty dwellings (including second homes).

    Prosper Australia uses Victorian water records to estimate that about half of Melbourne’s census-recorded vacant properties are long-term “speculative vacancies”. That’s 82,000 homes. A similar “conversion factor” to Sydney’s census numbers would indicate around 68,000 speculative vacancies.

    Labor Opposition shadow Treasurer Chris Bowen has proposed a national tax on homes left empty for six months or more.

    Pawson says these “cruel and immoral revelations” come at a time when 400 people sleep rough in Sydney every night and hundreds of thousands more face overcrowded homes or unaffordable rents.

    He says Australia has a bigger problem in terms of under-utilised occupied housing. Australian Bureau of Statistics survey data shows that, across Australia, more than a million homes (mainly owner-occupied) have three or more spare (read unused) bedrooms. A comparison of the latest statistics (for 2013-14) with those for 2007-2008 suggests this body of “grossly under-utilised” properties grew by more than 250,000 in the last six years.

    While authorities are grappling with the issue and how to perhaps tighten foreign ownership laws, the ANZ Bank did its own survey. Foreign buyers were playing an increasing role in spurring demand for new houses and apartments, it found. The ANZ analysed Reserve Bank data to conclude that in 2015-2016, foreign investors bought between 30,000 and 60,000 dwellings in Australia. This equates to 15% to 25% of all new dwellings, 80% of which were apartments, which can be bought ‘off-the-plan’.

    There is good reason to suspect that the new apartment markets in Hong Kong, Vancouver, London, Paris and other desirable world capitals are underwritten to some extent by foreign nationals (including Australians).

    The problem which could arise, say in the case of a global recession, is what happens in cities like Melbourne and Brisbane where foreign investors have bought up to 35% of new stock, if these owners are forced to sell.

    Not to worry, most big box discount stores will give you a large cardboard box in which to live. The dumpster bins behind shopping centres have perfectly good food that’s just been chucked out because it has passed the use-by date.

    Trust me.

    FOMM back pages

    Travel safe this weekend, people

    Don’t touch my dividends, Dude

    dividends-franking-credits
    Photo: “How will we afford dog food without the franking credits from our dividends?” pixabay.com, CC Mike Flynn

    There have been few occasions when dividends made it on to the front pages or lead item TV news. The first time was when Treasurer Paul Keating introduced the dividend imputation scheme in 1987, largely as a way of eliminating the double-taxing of company dividends. From that day, Australian investors were given franking credits on the dividends they received on their shares. This had the welcome effect of boosting the investment return for the investor or super fund.  It was just the sort of incentive needed to encourage Australians to prepare for their retirement and aim to become self-funded retirees.

    Keating’s scheme did not, however, include the cash refund of the franking credit component of the dividend, which was introduced by John Howard and Peter Costello in 2001.

    The second time dividend imputation was ‘trending’ was last week when Opposition Leader Bill Shorten said if Labor gets back into power he would scrap the current system. While emphasising Labor would keep dividend imputation, he said the plan was to scrap excess cash refunds on tax that was never paid in the first place,

    The main targets are people with super fund balances of $1 million and more. There are plenty of those distributed among the large super fund managers but also around 30% of the self-managed fund sector are in that category.

    In 2017, 1.12 million Australians were members of a self-managed super fund. There were almost 600,000 funds with assets totalling $696.7 billion. About 30% of SMSF assets are held in Australian shares, the ones that pay fully franked (tax-paid) dividends to investors.

    What Mr Shorten’s plan appears to lack is a sliding scale which would exempt retirees whose fund balance is below a certain threshold or whose franking credit refunds are below the average ($5,000 a year).

    A 2015 study which set out to debunk the myth that one needs a minimum $1 million to retire said that half of Australia’s workers approaching retirement have less than $100,000 in super. Three years hence, the proportionate numbers won’t have changed that much. The study by the Australian Institute of Superannuation Trustees (AIST) sets out to educate people that super is designed to work in tandem with the aged pension and that it’s OK to do that. Even a low super balance of $150,000 can nicely augment your pension.

    Yet Bill Shorten says some funds are paying zero tax but picking up a $2.5 million refund cheque. At face value, that would seem to be a loophole worth closing. But at the other end of the scale are individual SMSF members with low fund balances who are undoubtedly already receiving a Centrelink part-pension. The shortfall caused by scrapping cash refunds on dividends will inevitably be recovered via a tweaking of government pension calculations on income and assets. Those who do not qualify for the pension will lose the lot.

    Just how important a subject this is for retirees is shown in the Association of Superannuation Funds of Australia (ASFA) superannuation statistics: 1.427 million individuals received regular superannuation income in 2015-2016. Weekly payments averaged from $328 (term annuity), $496 (account-based) and $616 (defined benefit). Franking credit refunds on dividends from the ATO no doubt contributed to these payments.

    Some industry super funds have come out in favour of Labor’s plan, but there is plenty of opposition, though so far there is no detail on which to base a counter argument.

    ASFA says the proposal could have a significant impact on low-income retirees both inside and outside the superannuation system.

    Chief executive Dr Martin Fahy said the system already has a $1.6 million cap in the retirement phase and reforms to superannuation and  retirement funding are working but they need time to bed down.

    “If there is a concern about individuals with large retirement savings receiving the benefit of refundable imputation credits then this would be better addressed by measures more closely linked to retirement balance,” he said.

    Currently, the Australian Taxation Office demands that if SMSF Trustees draw a Simple Pension, it must be a minimum 5% of assets (rising through increments to 14% for those aged 95 and over (!). For example, a fund with two members under the age of 80 and a balance of $450,000 must pay its members a minimum of $25,000 p.a. Providing their other assessable assets and/or income is under the threshold, they can also receive a part pension from Centrelink which could bump their annual income to around $45,000, (somewhere between a modest living and a comfortable retirement). The upside (for the country) in this fiscal strategy is that earnings will (hopefully) keep the members’ balances in the black for as long as possible. This in itself eases the burden on the aged pension system.

    And if you need extra cash for a car, a bucket list trip to the Antarctic or to pay a ransom to a hacker, you can take a lump sum. If you’re Homeland’s Carrie Matheson, track down the troll, beat him up and demand he unlock the computer. (He just threw that in for light relief, Ed).

    Policy on the run

    You will forgive me for liberally quoting other sources on this thorny subject. The ALP has not published a policy paper or issued a media release. The only thing you will find is on Mr Shorten’s website, tucked away under the category: ‘Bill’s Opinion Pieces’.

    I initially found Bill’s piece on a website run by the authority on all things super, Trish Power. Power, starting from the same position as all, except for Fairfax Media, which ‘has seen’ a policy draft, suggests it has all the hallmarks of ‘policy on the run’.

    Trish Power’s website is a good place to visit if you want to avoid the scaremongering stories in the tabloids and current affairs TV. I bought a copy of her book “DIY Super for Dummies” and found it invaluable when starting our SMSF back in 2006. It may be overstating to say the promise of franking credit refunds was one of the attractions, but nonetheless it was.

    Power and other guest writers are following this story while it remains a live issue so if you have a vested interest, here’s the link:

    It does seem as if Bill Shorten is hanging his hat on this particular peg and plans to leave it there.

    “When this (cash refund) first came in, it cost Australian taxpayers about $500 million a year,” he wrote. “Within the next few years, it’s going to cost $8 billion a year, more than the Commonwealth spends on public schools or childcare. It’s three times what we spend on the Australian Federal Police.”

    You can see where he is shining his head torch when he writes that 50% of tax refunds go to SMSFs with balances of more than $2.4 million. Fine, stick it to the top end of town, but look further into this dodgy policy, Bill, and you will see that unless you giveretirees on modest incomes a break, they will be forced to rely more on the public purse. They will resent that and in turn resent you.

    FOMM back pages: http://bobwords.com.au/super-end-week/


    Cape Town’s water crisis and other updates


    updates-Cape-Town
    Graphic courtesy of the City of Cape Town

    Well-organised journalists keep detailed diary notes on the stories they have written, with the objective of writing updates. This is how the media knows when to descend on the courts when a murder trial finally starts. Or the updates could be on Twitter.

    From my lazy post-city desk where I opine and inform about random topics, updates rarely occurs to me. Yet the same subjects crop up again and again: climate change, global warming, ocean pollution, poverty, refugees, fast-changing technology. Yes, who’d be a technology writer today? Blink and you’ll miss it.

    So to the updates: you might recall I wrote on February 23 about Cape Town, South Africa, and how it was in danger of running out of drinking water. The city authorities have now decided to defer ‘Day Zero’, when all taps were to be turned off and people would have to queue for water at standpipes.

    Nearly a month later, the city authorities, having postponed Day Zero from mid-April to early June, have pushed it out to 2019, on a date to be notified. Level 6B water restrictions are still in place and residents are being asked to limit daily use to 50 litres each.

    Cape Town may not have thought ahead far enough to provide the buffer it might need after three years of drought, but they are making up for it with a well-thought out campaign to urge people to save water.

    They’d need to, because even though combined dam levels are back to 23.6%, if the level drops below 14%, Day Zero looms again. Cape Town’s authorities are aiming to reduce average water use to 450 million litres per day (last week it was 537m litres). When I wrote my column about this, I was harking back to South East Queensland’s dire days of drought, when our combined dam levels fell below 20%.

    Brisbane implemented Level 6 water restrictions, which, if you don’t mind an empty swimming pool and a dirty car, are not too onerous. At that time, people in South East Queensland reduced their daily water consumption to 140 litres per day (half the average use).

    Check out the graphic from the City of Cape Town (above) and you’ll get some idea of how bad it could be, even though we now have a Drought-Ready plan.

    In a curiously related aside, Cape Town recently had its own outbreak of listeriosis, not (as in Australia) from contaminated rock melons, but from processed smallgoods (with the responsible firm being named).

    The Cabinet shuffle continues

    Earlier in February I joined the outrage over the disposal of two ex-government filing cabinets, stuffed tight with confidential documents from the Department of Prime Minister and Cabinet. The ABC ran a series of stories based on the documents before handing them back (to ASIO).

    Not much in the way of updates on that front although PM Malcolm Turnbull, after saying ‘heads would roll’, called for an inquiry and appointed senior public servant Ric Smith to the task. The terms of reference released on February 21 promise a preliminary report in March.

    While the Canberra press gallery are waiting for the updates Smith continues with his task of finding out how it happened and how to make sure it never happens again. Smith would appear to have a job on his hands as this was no one-off; the Canberra press has published multiple stories involving confidential documents and diaries turning up in unsecure locations.

    For instance this week Canberra Times reporter Andrew Brown turned up a similar story, albeit from 2013. The Department of Social Services sent old filing cabinets to a second hand store. The cabinets turned out to be full of personnel files, with personal information including security clearances. Brown found the un-named resident who, having established what he had bought, spent his own time trying to give the documents back to the department. Only when he wrote to the department was action taken and the cabinets collected.

    A Department of Social Services spokesman said handling processes were ‘reviewed and updated’ as a result of the breach.

    Mushroom cloud, anyone?

    In early January I tried to lighten global nuclear conflict anxiety by revisiting a list of protest songs. This column was notable for the many examples of readers telling me, “Oh but you forgot about Good News Week…”

    That’s the trouble with lists: after you’ve read them you wonder why the author bothered. You know the click-bait headlines: “These 12 amazing boob jobs will blow your mind.” And so on.

    I’ve been noticing these cartoons of North Korea’s leader and The Donald facing off with missiles, one noticeably longer than the other.

    I do wonder how this larrikin symbolism is interpreted in the Democratic People’s Republic of Korea. Mind you, the average NK citizen would never be allowed to see such salacious mischief on their heavily censored Intra-net.

    After the fact, I was reading a fascinating book by Simon Winchester who in an astonishing feat of literary and journalistic ambition sums up the history of the Pacific Ocean in just one book. I’m two-thirds of the way in and he gets my vote thus far. The first chapter in Winchester’s Pacific covers the history of nuclear testing in the Pacific.

    Winchester does not hold back, telling of the uncaring, nay brutal way the islanders of places like Bikini atoll and the surrounding Marshall Islands were herded up and deposited ‘Elsewhere’ while western forces went about perfecting atomic weapons.

    He reveals that between 1946 and 1958 the US detonated 23 atomic bombs on or near Bikini Atoll. Though they moved the islanders, ‘Elsewhere’ did not provide them with enough food. So, half-starving they were transported to another Elsewhere (which did not have a coral reef so they were unable to practice the traditional lifestyle).

    Still, it had enough food.

    All told, between 1946 and 1962 the US exploded 105 atomic devices in the Pacific. The back story to this is a minefield of missed targets and mishaps, claims and counter-claims, compensation and persistent radiation levels.

    I’d recommend Winchester’s book for the thorough way he covers any question which might arise about complex subjects concerning the Pacific; the Ring of Fire, tectonic plates, how Korea became two countries, the theory of continental drift or how surfing became a mainstream sport.

    If you want a recap of the Bikini saga, the link below is as good a place as any. Georgetown University’s Timothy Jorgenson covers the sorry history of US atomic testing in the Marshall Islands chain.

    He starts with a reference to the genesis of the bikini (swim suit). Who knew that the original 1946 design by Jacques Heim was dubbed ‘Atome’ (French for atom)? Allors!

    Oh, and let’s not forget the 193 nuclear tests France carried out in Polynesia between 1966 and 1996. Tests were stopped largely because of protests inspired by the New Zealand government’s nuclear-free stance.

    In light of all that, you’d have to wonder why all the fuss about North Korea’s six (6) nuclear missile tests. Whatever case I’m making about super powers, hypocrisy and exploitation of huddled minorities, I rest it here.

    FOMM back pages:


    Rising sea levels and apocalyptic fiction

    rising-sea-levels
    Photo of Kulusuk, Greenland by Nick Russill, flickr/cc https://www.flickr.com/photos/nickrussill/146760303/

    I’d always thought my song about the mountain dwellers ending up on waterfront row because of rising sea levels was not to be taken too seriously. It was an apocalyptic view of what might happen if it didn’t stop raining and, moreover, not a terribly original idea as it turned out. But the risk of flash flooding from above-average rainfall is only half the problem for people living down there, at sea level.

    A loyal reader, visiting the coast from cooler climes down south was discussing his theories about rising sea levels and coastal tourist locations like Noosa, given news of the Arctic region’s third winter heat wave in a row. His attention had been drawn to Greenland, where temperatures have remained above freezing at a time of year when it should be at least 30 below. Clearly such weather extremes in the fragile ecosystem of the Arctic region must accelerate the process of rising sea levels?

    As The Independent reports, this is happening even though large parts of the Arctic Circle are trapped in perpetual darkness.

    New global projections forecast a sea level rise of 2m by 2100, compared to a 0.74m rise in a 2013 study. So far, the forecasts that oceans would rise on average by 3mm a year has provoked a scornful debate between believers and climate sceptics. Yes, the science is not wholly believed. There are people in high places who have made naïve and disturbing statement such as “coal is good for humanity”, at a time when most scientists agree that CO2 emissions, produced largely from human activity, must be reduced.

    The spectre of melting polar ice bringing an apocalyptic end to civilisation as we know it has been a favourite theme of science fiction writers for a long time. Now there is even a fiction sub-genre known as ‘cli-fi’ which has spawned many cataclysmic climate scenarios.

    The spookiest forecast, before cli-fi was a thing, was The Drowned World, J.G Ballard’s second novel, published in 1962. Ballard’s main character is a scientist in charge of a floating research station, drifting above a submerged London, beset on all sides by encroaching tropical jungle. A 50th anniversary edition (with an introduction by Martin Amis) has been released and it is available as an ebook. I’ve not read it, though, relying on Peter Briggs’ review for the synopsis.

    Ballard eerily conjured up a world where polar ice caps have melted and solar storms have left us in an irradiated world. Europe is a series of lagoons, devoid of human life, although the tropical bugs love it!

    The most recent book in the cli-fi genre which I have read is The Ice by Laline Paull. Her 2017 mystery novel begins with wealthy tourists aboard the Vanir, traversing previously frozen Arctic oceans. The mission is to find a (now rare) polar bear, but instead they find the thawed body of an explorer who went missing years ago in mysterious circumstances.

    Fiction aside, the alarming temperature rises in the frozen north have had a bizarre impact on Europe, the US and Canada in 2018, which at this time of year ought to be seeing the first thaws of spring. A day temperature of 1 degree celsius in Greenland might not seem too warm to us Aussies, but typically the days are often up to 30 degrees colder. And this is not confined to Greenland. The most northern US city (Utqiaguik, Alaska), has also been enjoying a balmy 1 degree celsius − again that’s 22 degrees above average.

    Meanwhile,The Independent observed that a relatively high pressure system over Russia and the Nordic north and a relatively low pressure system across the UK resulted in freezing Artic air being drawn towards the UK and causing exceptionally cold weather there.

    The chorus of Waterfront Row ponders: “Little did I think when I moved to the mountains, I’d end up on Waterfront Row, renting out my shed to all those who fled the torrents and the foment down below.”

    Imagine my chagrin upon writing and recording this song to be told (by a country music fan), that the song was similar (in theme) to Graeme Connors’ A Beach House in the Blue Mountains. I had not heard of the song but googled it (as you do).

    We’re not the only ones taking ‘cli-fi’ into the realms of songwriting. Sunshine Coast songwriter Noel Gardner made up this cheery tune about the low-lying island nation of Tuvalu. He takes the role of the climate sceptic to satirise the controversy about Tuvalu and rising sea levels.

    Some years back, the tiny Pacific island nation was said to be so prone to inundation its citizens might have to become New Zealanders. As it happens, some 2,400 Tuvaluans have already moved to NZ or neighbouring islands, according to a not-for-profit group that monitors world poverty.

    They may have moved too soon, if, as the article below says, Pacific atolls like Tuvalu actually grow and float, becoming impervious to rising tides.

    Now, a study confirms what we’ve already known – atolls, and in particular Tuvalu are growing, and increasing land area, writes Anthony Briggs. “So much for climate alarmism”.

    Nevertheless, the highest elevation on Tuvalu is 15 feet and it is perpetually exposed to rising sea levels, cyclones and tsunamis.

    An article in The Conversation says previous studies examining the risk of coastal inundation in the Pacific region have been conducted in areas where the rate of sea level rise is ‘average’ – 3mm to 5mm per year. A team of authors, led by The University of Queensland Senior Research Fellow Simon Albert unearthed outlying examples.

    At least five reef islands in the remote Solomon Islands, where sea level rises are in the order of 7mm-10mm a year, have been lost completely to rising sea levels and coastal erosion. A further six islands have been severely eroded. These islands range in size from one to five hectares and supported dense tropical vegetation that was at least 300 years old.

    Last year, new projections from the National Oceanic and Atmospheric Administration (NOAA) in the US revealed that global sea levels could rise by 2 metres by 2100 if emissions remain at their current levels. As the ABC reported, this is substantially higher than the 74cm increase proposed in a 2013 Inter-governmental Panel on Climate Change (IPCC) report. Under these new projections, Sydney’s Circular Quay, Brisbane Airport, Melbourne’s Docklands and North Fremantle would be among locations at risk. So too Stradbroke Island, the Gold Coast and Sunshine Coast, while in South Australia the seaside suburb of Glenelg would also be in trouble.

    Scarier predictions have been made, with scientists taking into account the prospect of Antarctica melting, as well as the Arctic, doubling predictions of a 2m rise by 2100.

    Should we care? By 2100, the youngest person I know will be 89, so maybe she will care. Her children and grandchildren definitely will.

    And what does this mean for Australia, where the majority of the population live along narrow bands of coastal land on the east and west coasts?

    You can scare yourself (or reassure yourself) by checking out this interactive website which allows you to see the predicted results of sea level rises wherever you happen to live.

    FOMM back pages


    The risks of losing our digital photos and memories

    digital-photo-memories
    South Brisbane (Southbank), circa 1978), just prior to construction of the Queensland Cultural Centre) Author’s photo scanned from a colour slide.

    Whenever I think about going through our thousands of family and travel photos, be they in digital form, colour prints or scanned to the computer, I develop what migraine sufferers assure me is not a migraine, just a headache.

    The problem begins with the lack of a system. Few people other than professional photographers or serious hobbyists catalogue their photos and negatives in a logical way. So good luck looking for that photo of your little brother skateboarding when he was 10. It’s in there somewhere.

    Recently, a family member took on a big project – to collect photos across seven decades to put in a book for my brother-in-law’s 70th birthday. This social media-savvy young person wisely, I thought, decided to capture the images permanently in a printed book.

    The early contributions of course were box brownie snaps from somebody’s shoebox, scanned and photo shopped where appropriate. Some were from colour slides, also scanned and photo shopped, usually to obtain a larger image. Then we delved into photo albums from the 1970s, 1980s and 1990s, until the digital folders began.

    Maybe we were late adaptors to digital cameras, but we seem to have left film and negatives behind only in the early years of the 21st century. By that time, they’d been in common use for a decade, even though Steve Sassoon of Kodak invented the first digital camera in 1975. We came home after a six-month sojourn abroad in 2004 with 60 CDs of photos we burned from images downloaded on to a borrowed computer.

    Since then, my non-system has accumulated piecemeal on laptops, back-up drives and memory sticks. She Who Also Takes Photos has a smarter system in that she can readily find images by subject.

    No such luck on my computer. For example, a folder labelled ‘March, needs sorting’ on review contains just 15 (of 97) images worth keeping. In the late 1990s, we both clung to shooting film on SLRs and sending the film off to a cut-price mail order business. Digital cameras and later cameras in smart phones replaced this process, which was costly.  You often had to wait a week or more until you could relive the memories from Aunt Gladys’s 90th. If only she hadn’t blinked.

    I recall learning how to produce my own prints from negatives, albeit in black and white. Few young people today would know the thrill of seeing a photo you took that day materialise in a tray of chemicals.

    If you watched the Netflix series, The Crown, you’d have seen a dramatization of one of the best film photographers of the time in action. Tony Armstrong-Jones is depicted in the dark-room with his latest amour (Princess Margaret), trying on what appears to be a well-rehearsed seduction technique. He’d taken an intimate shot, with bare shoulders – against mores of the time (1959). Margaret, who comments, “It’s a Margaret nobody has seen,” resists his blandishments (but not for long, Ed).

    Film and self-processing makes a comeback

    As Alexandro Genova wrote in Time magazine last year, there is a small but determined resistance to digital photography among amateurs and professionals alike. Some are effusive about film and its “unexpected palette, the grain and dynamic range”.

    Portraitist Ryan Pfluger says of Kodak’s decision to revive Ektachrome film, that the “creamy ’70s tone” channels his fascination with memory and nostalgia.

    Genova’s article is framed by a stunning shot of a wildfire in Glacier National Park, Montana. The image is by professional photographer and artist David Benjamin Sherry, who processes and prints his own work.

    “There’s a spirituality that’s connected to it. I go out to take the pictures and at the end of the day I’m by myself, alone with my thoughts, in the dark room. It becomes very meditative,” he told Genova.

    No doubt the majority of hobbyists, oblivious to this meditative magic, will continue to snap what used to be called ‘candids’ on their smart phones. They can then post instantly to Facebook, Instagram, or other social media outlets.

    The 2004 earthquake and tsunami in the Indian Ocean revolutionised the way media covers news. Digital Spy’s correspondent Hunter Skipworth says the stark images of the tragedy were filmed by ordinary people, using their phones to capture images and video. From then on, anytime a major news event happened, anywhere in the world, it would be filmed by a citizen on their smart phone. That was a fairly short advance from the first commercially available digital SLR in 1991 (Nikon’s 1.3 megapixel camera, intended for use by press photographers). By the mid-1990s Casio, Kodak, Sony and others joined the race to produce an affordable digital camera. Digital Spy reveals that Apple had a short-lived flirtation in this field in 1995 with the QuickTake 100. Apple went on to focus on the Iphone with built-in cameras. Good move, Steve.

    Most smart phones have cameras which have at least 4 megapixels and often up to 12mp – good enough quality for a ‘citizen’ photo. The practise is so widespread now most newspapers carry a regular ‘reader’s photo’.

    However galling that may be to professional photographers and videographers who spent a lifetime learning their trades, it comes down to who first captures the image.

    Facebook, which had a modest debut in 2004, surfed in on an explosive wave of change. The introduction of the iPhone in 2007, universal access to broadband and perhaps the invention of the ‘selfie stick’, all helped Facebook become the behemoth it is today.

    My friend Mr Shiraz is slowly collecting images of his now adult children (and their offspring), with the idea of permanently preserving them in photo albums. He’s not alone in this quest.

    Like others with Gen Y and Gen X offspring, he can see the potential for a catastrophic fail arising from the ubiquitous habit of impulsively posting memorable photos, trusting the archiving to that most nebulous of beasts, The Cloud.

    Here’s an example, from the days when hacking mischief was in its infancy, of what can go wrong. In 2001 our computer was infected by the I Love You virus, which among other nasty deeds corrupted all JPG files. It was not such a disaster for us as we were still mainly wedded to film.

    As we plough through our old photos, a common problem arises. Here’s your father as a young lad, standing with…now who are those three other people? There’s nothing written on the back and the people who could tell you are long gone.

    The same fate awaits the millions of images consigned to the ‘cloud’ –data servers located, well, somewhere. You can establish when the image was taken, but not by whom. Nor, unless someone has ‘tagged’ the images with people’s names, can you determine who is in the photo or where it was taken.

    What is even more annoying is not knowing who took the photograph: surely that matters? I’ll leave you with this rare snap of The Goodwills busking in Melbourne’s Bourke Street (a while ago).

    No, I don’t know who took it. Perhaps it was a ‘selfie?’